Our Data Collection Method
Open Source Medical Supplies tracked the combined datset of community-made PPE and medical supplies at a global level during 2020. We have two primary sources, the weekly tally from March-August 2020 as well as an in-depth Community Impact Survey.
For the Tally, we organized weekly public statements from members of our 72,000 person Facebook group sharing their production data. Here’s an example of our weekly tally collection. We chose to leverage public Facebook Group posts, rather than using survey forms, to increase transparency and community interaction. Data submitted by 300+ partnering organizations was vetted before it was included in our reporting.
Our second dataset, the Community Impact Survey, was organized together with Nation of Makers (NOM). This survey went in-depth on technologies used, group status, partnerships built as part of the PPE production and the relationship between makers and policy-makers. The Dashboard below provides a compound insight into these two datasets.
We have compiled additional infographics below; each of them draw either from the Tally data directly, or from a combined dataset between Tally, Community Impact Survey and Fab Foundation data.
Interactive Infographic: 
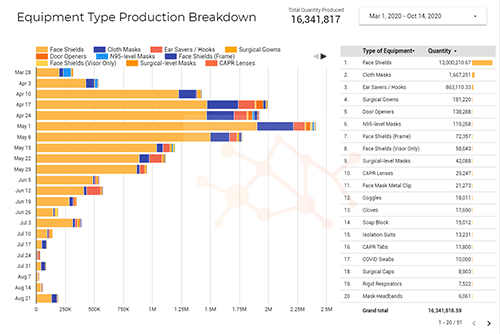
Equipment Types Produced (Tally)
This infographic is exclusively fed by the Tally data we’ve obtained between March and August 2020, and therefore tracks a total of 16 Million devices. You can interact with our dashboard by clicking on specific equipment types, or selecting them and the date ranges from the dropdown menus on the top.
Interactive Infographic: 
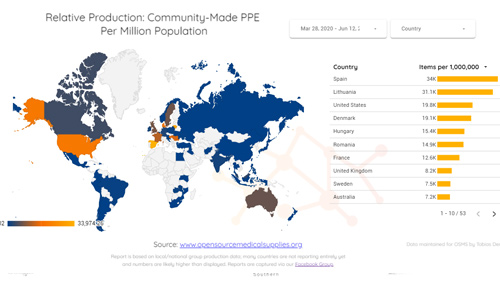
Relative Production Data, Normalized by Population (Tally)
This infographic is exclusively fed by the Tally data we’ve obtained between March and August 2020, and therefore tracks a total of 16 Million devices. The above infographic displays relative production – PPE items per million population – for each of the 55 countries we have received production data from.
Interactive Infographic: 
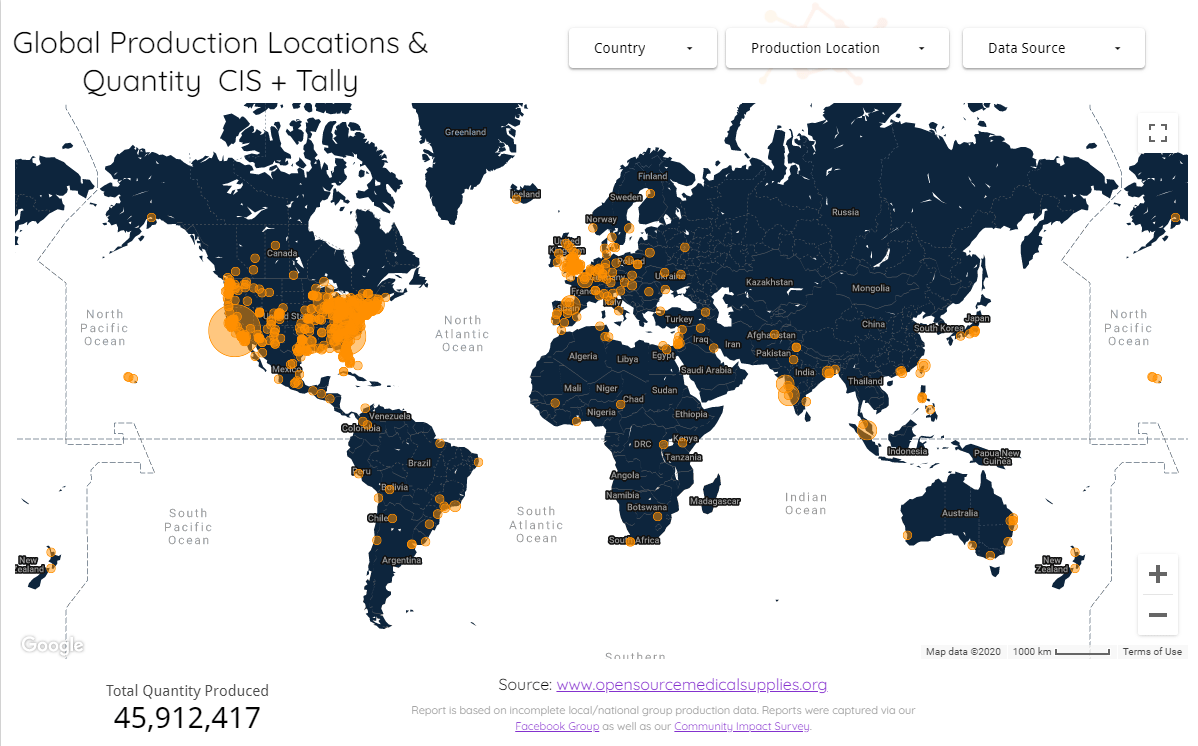
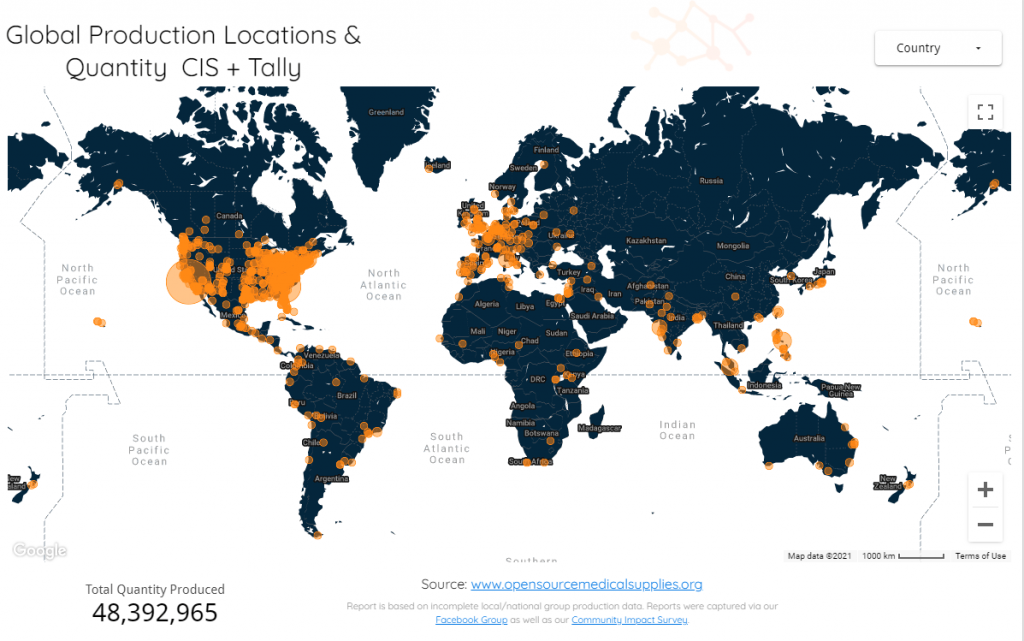
Production Quantities by Locations (Full Dataset)

This data includes OSMS’ Weekly tally, the Community Impact Survey, and data supplied by the Fab Foundation. The above infographic opens in a new window due to mapping requirements. It displays the cities, states and countries of our data sources. Some organizations are nation-wide collaborations, so the pins are centered within these countries. You can filter by country.
Add Your Data
Register with our OSMS Local Response, connect with fellow leaders and add your production numbers to the global total.
Join Our Impact
Want to get involved, become a partner in solving big problems, or learn more about our data?